Do you want to know more? What does it tell us about the future?
As usual for this time of year, thanks to the Clarke, Modet & Cº Spain INDEX, we can make an end-of-year forecast for 2017 (1) regarding the main Industrial Property indicators that reflect the actions of Spanish applicants.
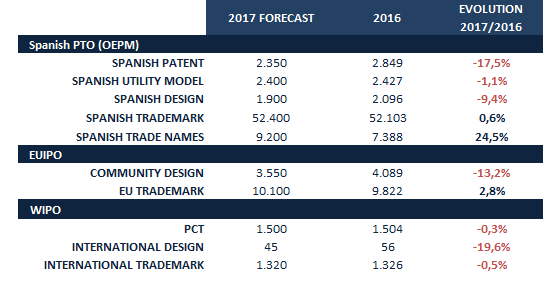
2017 end-of-year forecast for applications of different types of Industrial Property. The applications managed by the EUIPO and the WIPO correspond to applications submitted by Spanish applicants. Source: Compilation based on data from SPTO (2), EUIPO and WIPO.
Overall, the data that we gather today follows the trend that we already noted in our July 2017 forecast (3).
Like before, we emphasize the so-called “regulatory leap into the unknown effect” (4), one of the most interesting effects that occurs when there is a regulatory change with effects that involve a certain level of uncertainty. If we focus on the main evolution indicators, the following is worth noting:
1. We can see that those who predicted a substantial decrease in Spanish patents this year will not be mistaken, and we hope that this decrease exceeds the 15% that was estimated. The data may indicate this, however, it still seems that the indicators mark a new average for monthly Spanish patent application, from 250 in 2016 to 150 with the New Law, meaning that we estimate that in 2018 we will see year-on-year decreases that are greater than 30%.
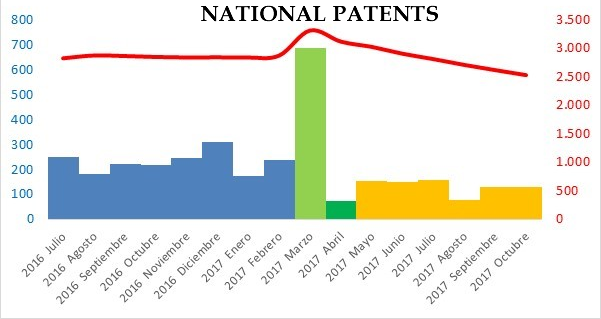
Monthly Spanish patent applications; year-on-year evolution in red; the month prior to the entry into force of the New Patent Law in light green; the following month in dark green
2. Unfortunately, the transfer effect of Spanish patents to utility models, and from utility models to designs has not occurred or at least it not has taken place with the intensity expected.
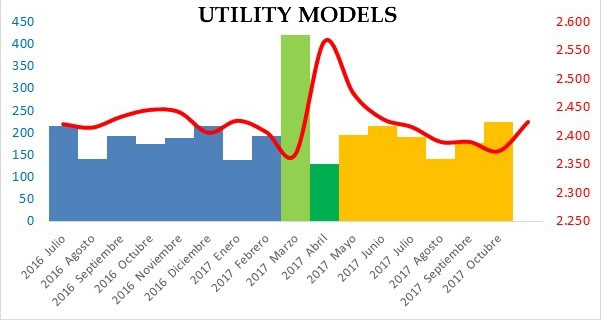
Monthly Spanish utility model applications; year-on-year evolution in red; the month prior to the entry into force of the New Patent Law in light green; the following month in dark green
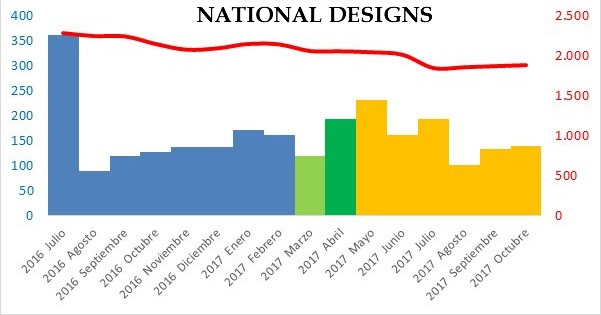
Monthly Spanish design applications; year-on-year evolution in red; the month prior to the entry into force of the New Patent Law in light green; the following month in dark green
3. Similar to recent years, it seems that the figures related to distinctive signs only indicate a relatively positive evolution, although, just as we indicated in October of last year (5) we are concerned with the indicators of International (non-European) Trademarks and some Spanish Trademarks, which have worsened considerably.
Regarding European Union trademarks, it is important to note that for the first time in history, Spain seems to confirm that the imaginary cap of 10,000 annual applications will be exceeded. Only Germany, the United States, Italy and the United Kingdom, in this order, have reached this level and this year it is expected that China, along with Spain, will also reach the platform of +10,000 applications
Another aspect that has caught our attention is the explosive growth of trade names since June 2017. What does this mean? Some attribute this fact to the creation of trade companies, so we will see what happens over the next few months.
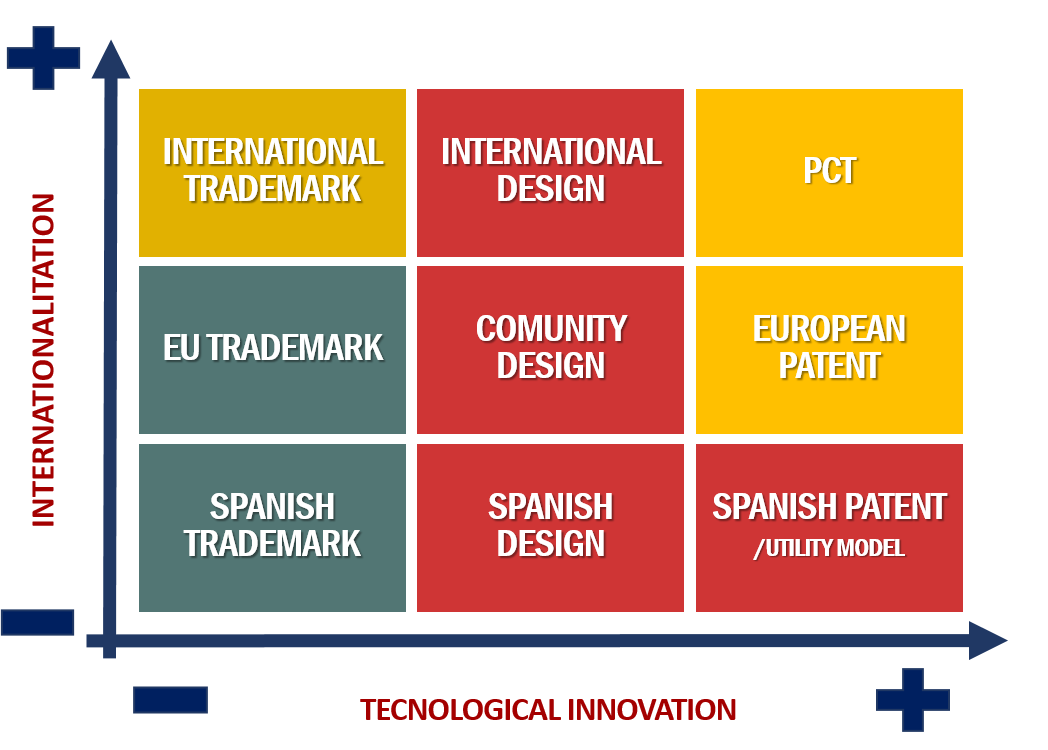
4.Furthermore, we are especially concerned with the figures related to designs and patents, which are critically highlighted in red and yellow in our table, and which indicate to us when we expect those designs and figures to establish a negative trend (red) or when they are stagnant (yellow).
All of these indicators would not be especially relevant if we did not know that they are directly related to other essential indices for the country, particularly those associated with competitiveness. Because of this, over the next few months, we will especially monitor the data that appears and we hope that the performance during the second half of the year will correct what currently seems to be a poor year.
[1] The forecast is based on updated data from October 2017, which was published by the SPTO, EUIPO and WIPO and where the historical average of the error ratio is 3.1%.
[2] We should particularly mention the good work of the SPTO, which has one of the most streamlined and complete statistical systems that we know.
[3]
[4]
When there is a new far-reaching regulatory change, such as the entry into force of the new Patent Law on 1 April 2017, it is common to “squeeze” out the last effects of the known law as much as possible and distrust the new law. As a result, applications significantly increase in the final month of the expiring law and decrease the following month. Then the following months should reflect normal activity for the new regulation.


